
一些Linux平台性能分析工具
本文记录一些linux平台很好用的性能指标收集和分析工具。以下命令皆运行在ubuntu 16.04上。
dstat
以下介绍摘自man page。
Dstat is a versatile replacement for vmstat, iostat and ifstat. Dstat overcomes some of the limitations and adds some extra features.
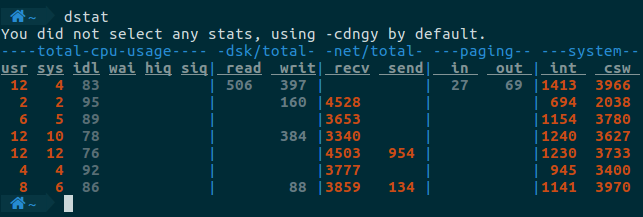
不加任何参数,直接运行dstat,它会默认使用-cdngy这几个选项。这几个选项的含义是: c : cpu stats d : disk stats n : network stats g : page stats y : system stats。
输出:
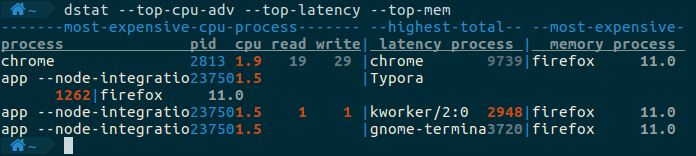
展示使用cpu最高的进程,最慢的进程,使用内存最多的进程。这里的latency是指调度的延迟,参考:https://www.kernel.org/doc/Documentation/scheduler/sched-stats.txt
dstat --top-cpu-adv --top-latency --top-mem
输出:
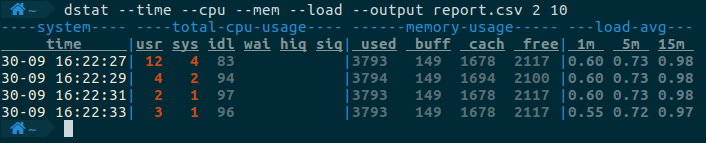
可以将dstat的输出保存在csv文件当中。例如如下命令,每2秒统计一次相关的指标,一共统计10次,将结果存入report.csv中。
dstat --time --cpu --mem --load --output report.csv 2 10
输出:
参考: https://hostpresto.com/community/tutorials/how-to-install-and-use-dstat-on-ubuntu-16-04/
pidstat
pidstat的功能很丰富,它可以上报进程乃至线程的资源使用情况。这里主要列举对具体某个进程的监控方法。
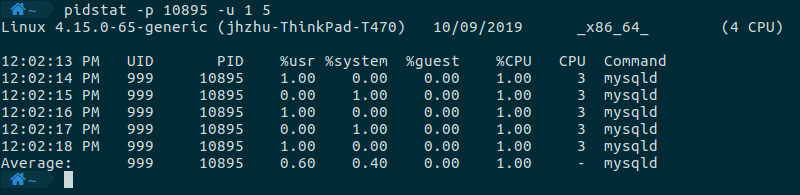
首先是监控某个进程的CPU使用情况,命令如下,-p指定了要监控的进程PID(不指定则会打印出所有进程的CPU使用情况),-u表示只监控CPU使用,1表示采样间隔为1秒,5表示一共采样五次。
pidstat -p 12349 -u 1 5
命令执行的结果如下所示,列出了用户态、内核态执行的CPU使用情况,以及总的CPU使用情况。如果想要查看进程中所有线程的CPU使用情况,可以带上-t这个选项。
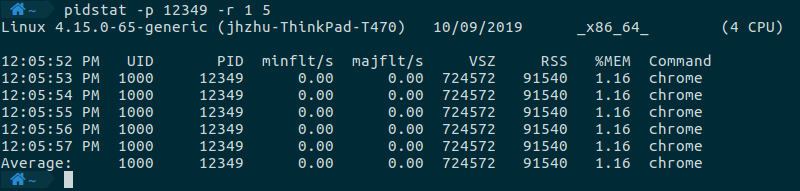
监控内存使用情况,需要使用-r这个选项。
pidstat -p 12349 -r 1 5
命令执行的结果如下所示,列出了总的虚拟内存使用情况(VSZ,表示可访问的虚拟内存,也就是这个进程生命周期里分配的所有虚拟内存),和常驻的内存使用情况(RSS,表示常驻的内存使用情况)。
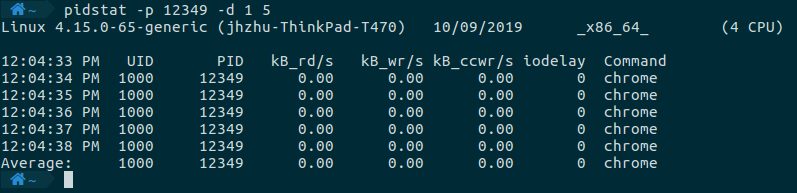
监控磁盘的使用情况,需要使用-d这个选项。
pidstat -p 12349 -d 1 5
命令执行的结果如下所示,列出了这个进程的读写速率。
sar
和pidstat不同,sar可以用来监控系统整体的资源使用情况。
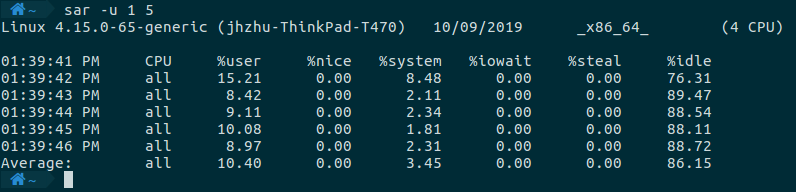
监控系统整体的CPU使用情况,需要指定-u这个选项。
sar -u 1 5
命令执行的结果如下所示。
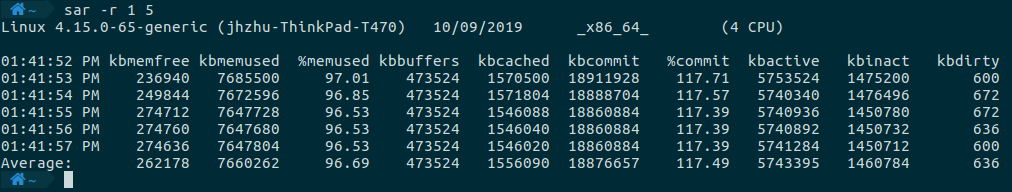
监控系统整体的内存使用情况,需要指定-r这个选项。
sar -r 1 5
命令执行的结果如下所示。
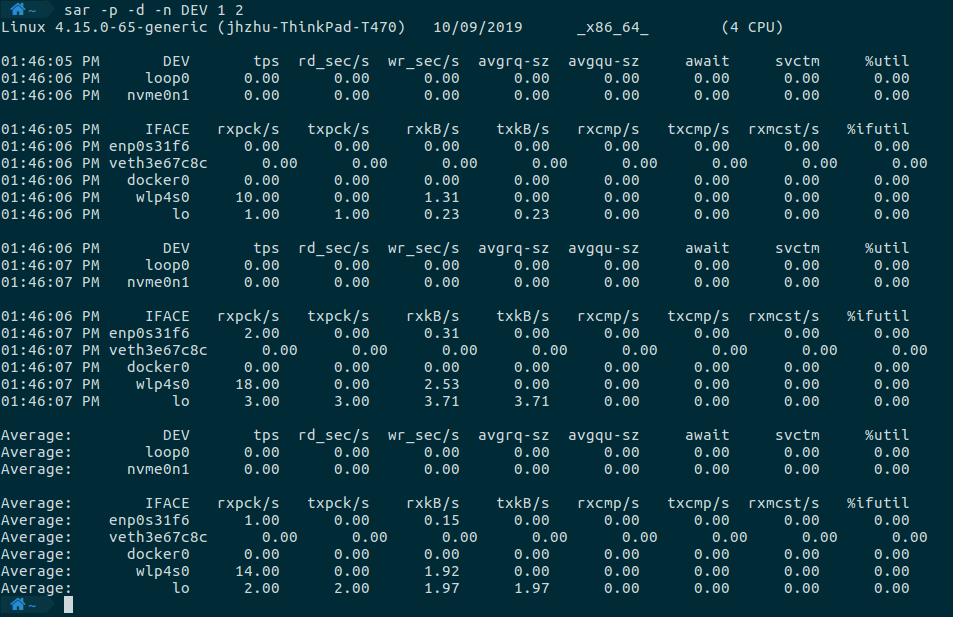
监控系统整体的磁盘IO、网络IO情况,需要指定-d,-n等选项。DEV用来指定上报网络设备的统计信息。
sar -p -d -n DEV 1 2
命令执行的结果如下所示。
perf
perf是一个十分强大的工具, 可以让我们对程序运行时的各种资源是用情况进行剖析。
These are some examples of using the perf Linux profiler, which has also been called Performance Counters for Linux (PCL), Linux perf events (LPE), or perf_events.
perf_events is an event-oriented observability tool, which can help you solve advanced performance and troubleshooting functions. Questions that can be answered include:
- Why is the kernel on-CPU so much? What code-paths?
- Which code-paths are causing CPU level 2 cache misses?
- Are the CPUs stalled on memory I/O?
- Which code-paths are allocating memory, and how much?
- What is triggering TCP retransmits?
- Is a certain kernel function being called, and how often?
- What reasons are threads leaving the CPU?
perf的使用方式相当丰富,具体可以参考这个链接,它有丰富的示例,可以作为一个使用手册来参考,这里不再赘述。